

In the fast-paced world of online grocery delivery, making data-driven decisions quickly can be the difference between delighting customers and losing them to a competitor. Therefore, at Picnic, real-time monitoring is essential, especially in our order fulfilment operations. For example, warehouse operators need real-time data to make sure orders are ready for on-time delivery. Additionally, consumer-facing applications like personalization and machine learning require real-time data to deliver seamless customer experience.
To meet these demands, the Analytics Platform team has built the real-time insights (RTI) platform, a solution designed to empower data analysts with a robust data pipeline that enables them to develop operational dashboards on top of the company’s data.
RTI is built with the platform engineering paradigm in mind. We built a solution which takes away the technical heavy lifting, streamlines common tasks and automates and simplifies infrastructure management. Just like Picnic’s page platform, which enables analysts to change the content of our customer-facing app, RTI enables data analysts to configure and deploy real-time data dashboards for monitoring operations.
RTI does the technical heavy lifting such as data sourcing and provides data processing capabilities and visualization. It enables data analysts to discover and explore relevant data in a self-serving way. They can define and deploy transformations on top of this data to visualize all important operational metrics needed.
This blog post dives into the RTI platform’s goals, architecture and platform features.
Goals
The RTI platform is both the data pipeline and a database for our analysts. This abstracts away the technical overhead, allowing them to focus on business logic. Its main goal is to make real-time operational monitoring simply a matter of configuration and SQL query development. The platform automates data ingestion and table provisioning in such a way that all relevant data is sourced into the system automatically. The deployment of new data sources is fully automated, instead of requiring code changes by developers. Users can develop analytical queries, share and iterate over them easily. The platform should be generic enough to cover most data sources that exist in the company.
Solution Architecture
To achieve these goals, we evaluated existing solutions but found that none met our needs for automation, flexibility, and ease of use across diverse data sources, leading us to design a custom platform tailored to our analytics requirements. RTI’s architecture is inspired by the Kappa architecture, a data streaming architecture in which an incoming series of data is first stored in an event streaming platform like Apache Kafka. Deriving from this architecture, real time analytics solutions typically have a number of distinct components.

Components
Event Sourcing Layer
The event sourcing layer collects backend and frontend event data, such as warehouse process data and in-app clickstream data. Slowly moving dimensional data is also synchronized from other analytical systems like the data warehouse, providing context like employee or product information. Integration technologies, such as Kafka Connect enable seamless data flows from source systems into the transport layer.
Transport layer
In the transport layer, event processing middleware facilitates data movement. Key implementation technologies include RabbitMQ, Apache Kafka, and a HTTP based interface for user-defined JSON data. The preferred way of data ingestion is Apache Kafka, because it supports PubSub patterns and allows for re-processing of data. In RTI, we use a custom built Java application to ingest data from the transport layer into the processing layer. This application also makes sure that the right data source ends up in the right raw events tables.
Processing Layer
In the processing layer, the raw data is parsed, transformed and aggregated. This is the most complex component, because this is where the business logic resides. The center-piece of this layer is ClickHouse and its real-time materialized views feature and periodically computed refreshable materialized views. The materialized views in ClickHouse parse raw JSON into materialized columns and continuously pre-compute results. The data is denormalized as much as possible for better read performance. We recommend users to handle as much data transformation as possible in this layer. By doing this work upfront — at the time of data insertion — we reduce the amount of computation required when the data is read in the serving layer. Ultimately, this results in a smoother and more responsive experience for end users.
Serving Layer
The serving layer is also implemented using ClickHouse. Different table engines, such as append-only (MergeTree), upsert (ReplacingMergeTree), and aggregating tables (AggregatingMergeTree), provide the desired table semantics for different use cases. Analysts can write free-format SQL queries to access data from the serving layer, which resides in a specific schema within ClickHouse. Here we allow free-format queries from Grafana to ClickHouse but we monitor the complexity of queries in this layer closely in order to provide snappy dashboards. Ideally the queries in the serving layer should be very lightweight.
Visualization Layer
In the visualization layer, Grafana serves as the primary tool. ClickHouse is connected as a datasource to Grafana. Dashboards and alerts make it a valuable tool for operational monitoring and decision-making. In addition, Grafana sends user information to ClickHouse to enforce GDPR compliance, safeguarding sensitive information.
Platform engineering
RTI is designed as a data platform for analysts, aiming to minimize the technical heavy lifting required of them. The engineering team assures technical quality by automating builds, implementing build checks, conducting PR reviews, and monitoring service level objectives (SLOs). Additionally, new queries are automatically checked for technical correctness and deployed seamlessly via our CI/CD pipeline.
Data sourcing
Analysts can add new data sources, such as Kafka topics or RabbitMQ queues, by submitting a pull request of only a few lines of yaml configuration code (see below). After deployment, the RTI application automatically integrates the source into the ingestion process. The user-driven management of data sourcing is an important part of the platform character of RTI, because adding new sources is fully self-service.
sources:
   tables:
     - name: delivery_details_event
       meta:
         type: KAFKA
         topic: "picnic.deliveryservice_deliverydetailsevent"
         ttl_days: 10
Data processing
The raw data is written as JSON to ClickHouse. From here, we make use of ClickHouse materialized views to parse and process the data. ClickHouse materialized views are continuously processing and transforming data as it arrives.
In order to control and manage these data transformations, we use dbt. Dbt is a game-changer in terms of maintainability and validation of queries correctness, because it enables a reliable and repeatable deployment. The ability to add additional meta-data is crucial to manage ownership of each table.
Every change to the database needs to be validated and pass quality checks. To achieve this, our CI/CD solution runs a full build of the ClickHouse database for each new query with additional checks on the completeness and correctness of the new code. We also leverage our open sourced dbt-score tool for this.
Below is an example of a dbt model’s configuration. The meta field contains additional information we use to alert the owners of a model if a change happened to the model.
---
models:
 - name: fulfilment_clearing_tasks_summary
   description: "{{ doc('fulfilment_clearing_tasks_summary') }}"
   config:
     ttl: toDateTime(load_time) + interval 4 day
     order_by: warehouse_id, load_time
     engine: MergeTree
     contract:
         enforced: true
   columns:
     - name: load_time
       data_type: DateTime64(3, 'UTC')
       description: Time the edge system uploaded the data.
     - name: warehouse_id
       data_type: LowCardinality(String)
       description: The warehouse identifier.
     - name: n_pick_locations_blocked
       data_type: UInt32
       description: Number of pick locations blocked.
   meta:
     owner: "Peter Picnic"
     team: "Supply Chain"
     alert_slack_users:
       - "U0123456789" # "Peter Picnic"
Monitoring
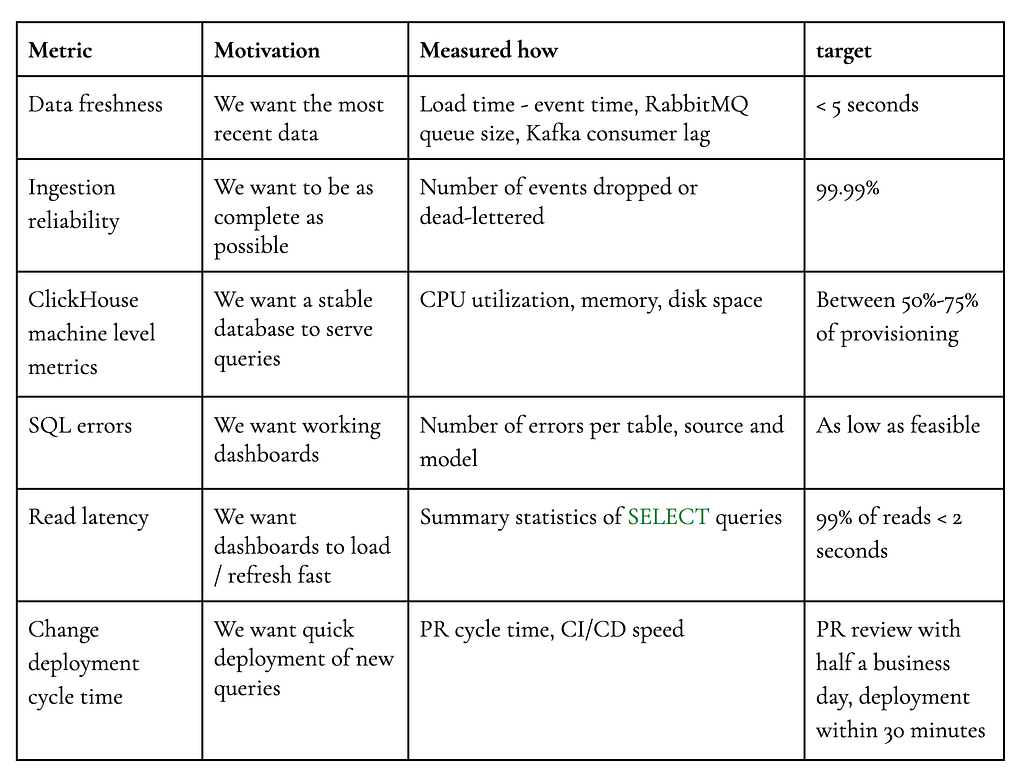
RTI has grown quite a bit in its three years of life. At peak hours, RTI ingests around 1500 events per second and a total of around 500 GB per day. Outgoing traffic to Grafana is around 25 GB per day. We achieve a total event delay from source to serving layer within 5 seconds.
To ensure stability of this shared platform, monitoring is key to ensure that there is no systemic problem. Issues stemming from one particular use case can affect many teams because they share a platform. We monitor the following key metrics with a combination of alerts, visualizations and SLOs.
Collaboration, docs and user interaction
A platform should create a space for your users to ask questions, exchange ideas and ask for support. The Analytics Platform team’s developers do this in a dedicated Slack channel, technical docs and pull request reviews on GitHub. It is important to have such exchanges publicly available to avoid knowledge silos. Our experience is that the more the users of your platform engage in collaboration, the more productive they become with the tool. We also conduct intake meetings and topical sessions for more difficult issues.
Conclusion
The real-time insights platform is a testament to how real time analytics and platform engineering can drive operational excellence in a competitive industry. By enabling self-service analytics and providing instant visibility into critical operational metrics, RTI has become a cornerstone of our operations. We’re excited to continue refining and expanding this platform to meet the needs of our growing operations.
Building a Real-time Analytics Platform for Picnic was originally published in Picnic Engineering on Medium, where people are continuing the conversation by highlighting and responding to this story.
